
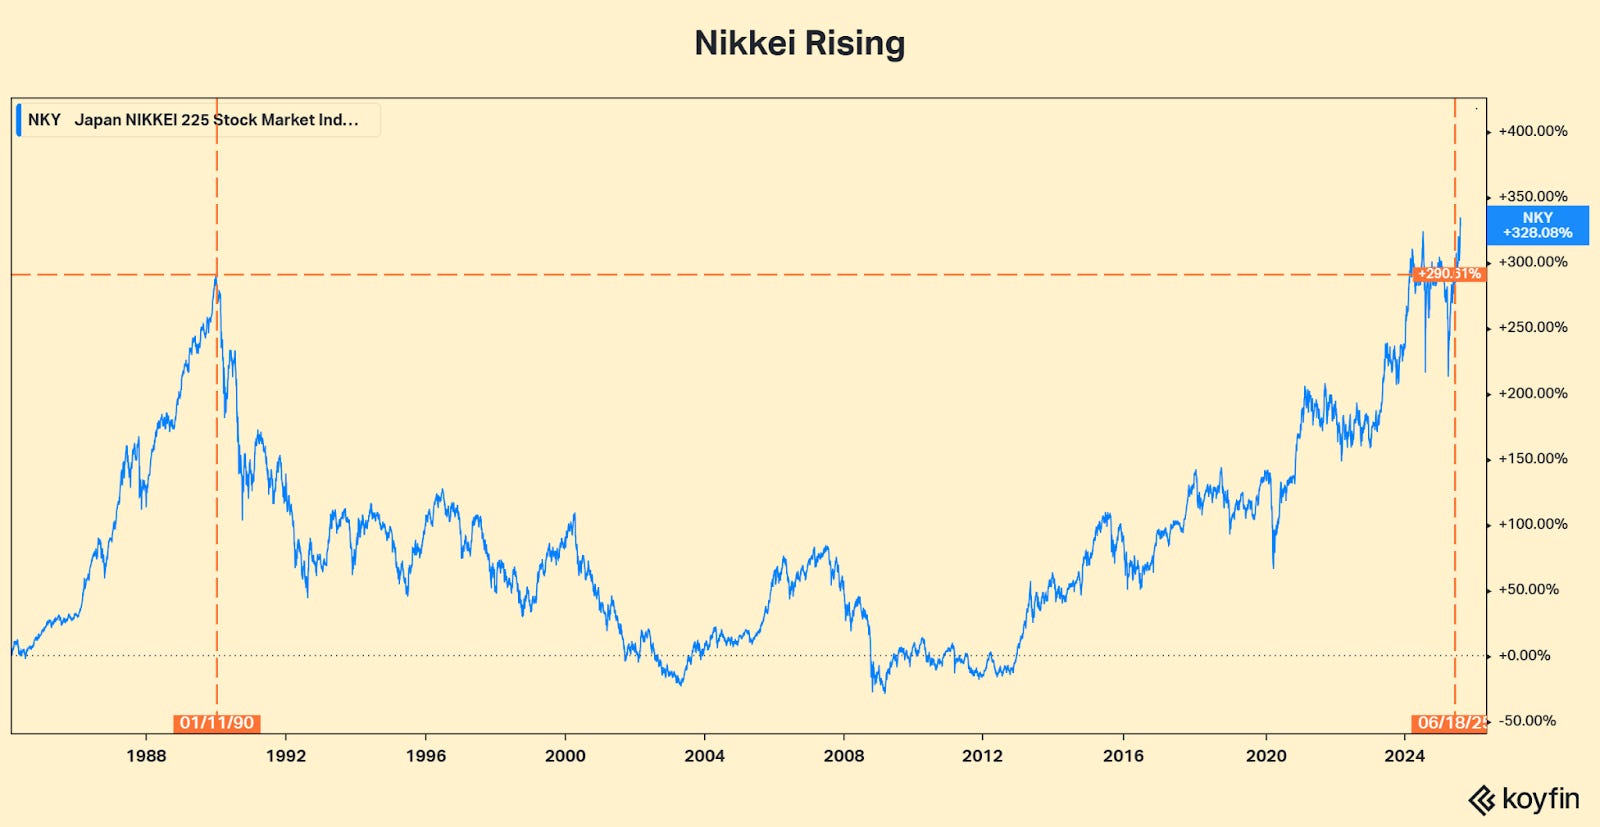
What does this chart show?
This year, the Nikkei 225, the premiere Japanese stock market index, made a fresh all time high, eclipsing levels last achieved 35 years ago in January of 1990.
Why does it matter?
The Nikkei run through the late ‘80s represents one of the great speculative market bubbles of all time. At one point, Tokyo’s Imperial Palace was notionally worth more than all the real estate in California.
The wealth destruction that followed led to a multi-decade economic stagnation as real Japanese GDP plunged from 4% per year in the ‘80s to ~1% per year for the next 3 decades as the banking system unwind of bad debt along with corporate reforms took a massive real and psychic toll on corporations and investors.
The Bottom Line
The lead up to bubbles never repeats but often rhymes - cheap credit, speculative behavioral feedback loops, easy policy/regulation - and can be monitored.