Chart of the week
AI - a disruptive or sustaining technology?
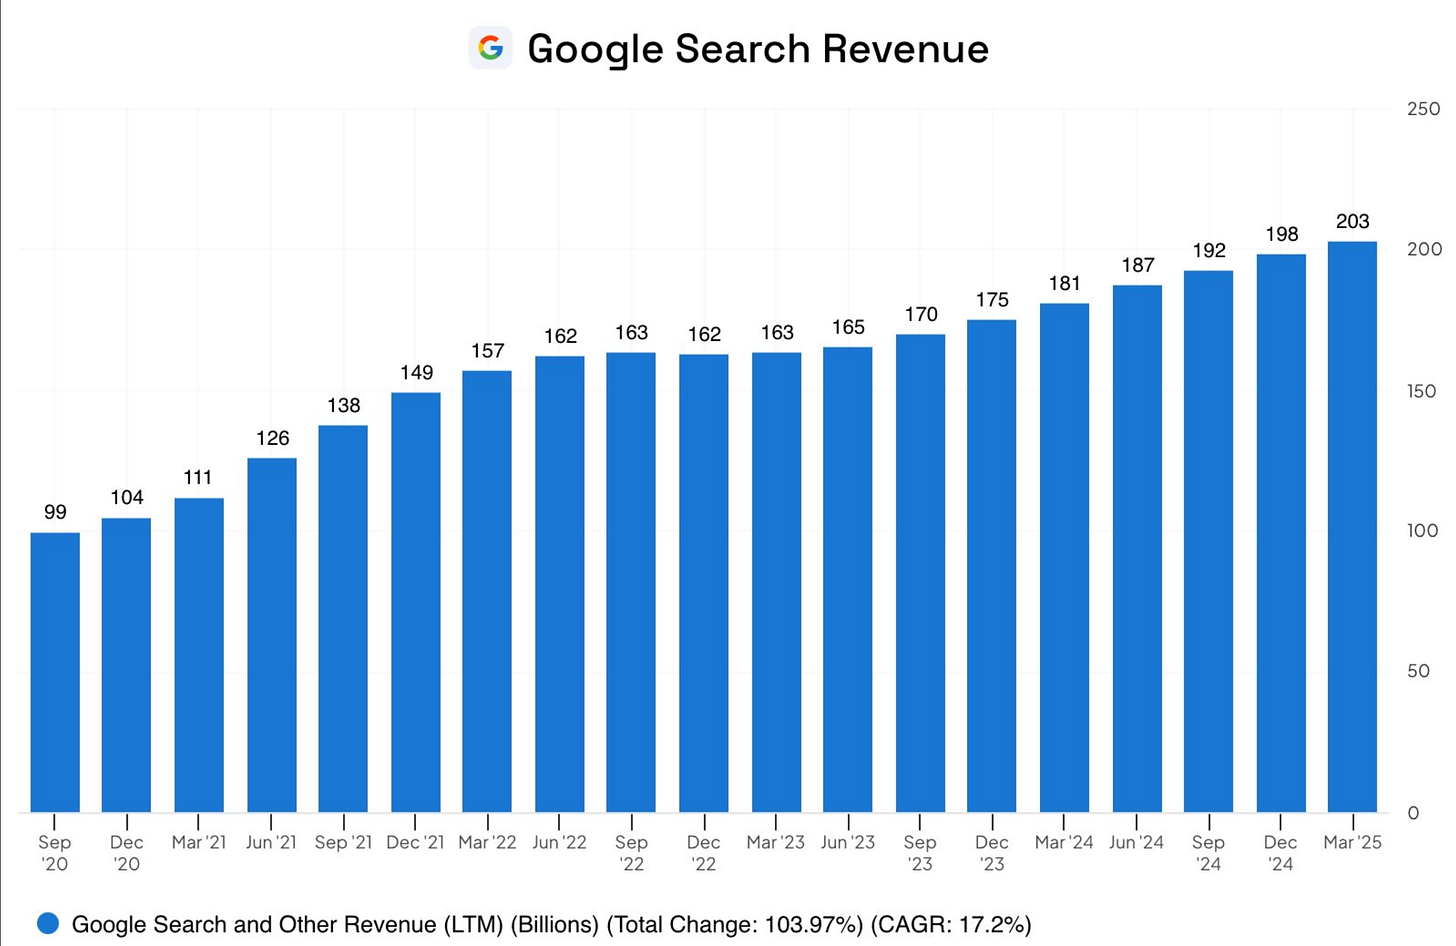
What does this chart show?
From September 2020 to March 2025, Google’s search and other revenue grew from $99 billion to $203 billion, a 17.2% compounded growth rate.
Why does it matter?
With hindsight being 20/20, the most obvious trade of the last decade(+) has been an equal weighted basket of the big tech behemoths1. They have monopolistic business models and are ubiquitous in our everyday lives, seemingly undisruptable. The performance of this equally weighted basket has demonstrated that, earning a 25% compounded annual return since 20122, nearly twice the annual return of the S&P 500.
The emergence of AI, and the technologies and business models that it will enable, beg the question - will AI be a disruptive technology, as past tech revolutions have been, enabling upstarts to creatively destroy the incumbents ? Or will AI be a sustaining technology, further entrenching the already impenetrable moats of big tech?
This may be one of the best charts to monitor to gain insight into this key question. As consumers want answers, not 10 blue links, and increasingly want agentic AI systems to fully accomplish tasks on their behalf, will the incumbents be nimble enough to navigate this shift?
The Bottom Line
It remains to be seen if AI will ultimately be a sustaining or disruptive technology, but this may be among the handful of charts to keep an eye on. If AI is a disruptive technology, perhaps the ‘most obvious’ trade is in peril, or if it’s sustaining, perhaps investors should leaning in harder.
Chart & Data Sources: FinChat
AAPL, META, AMZN, GOOGL, MSFT

