
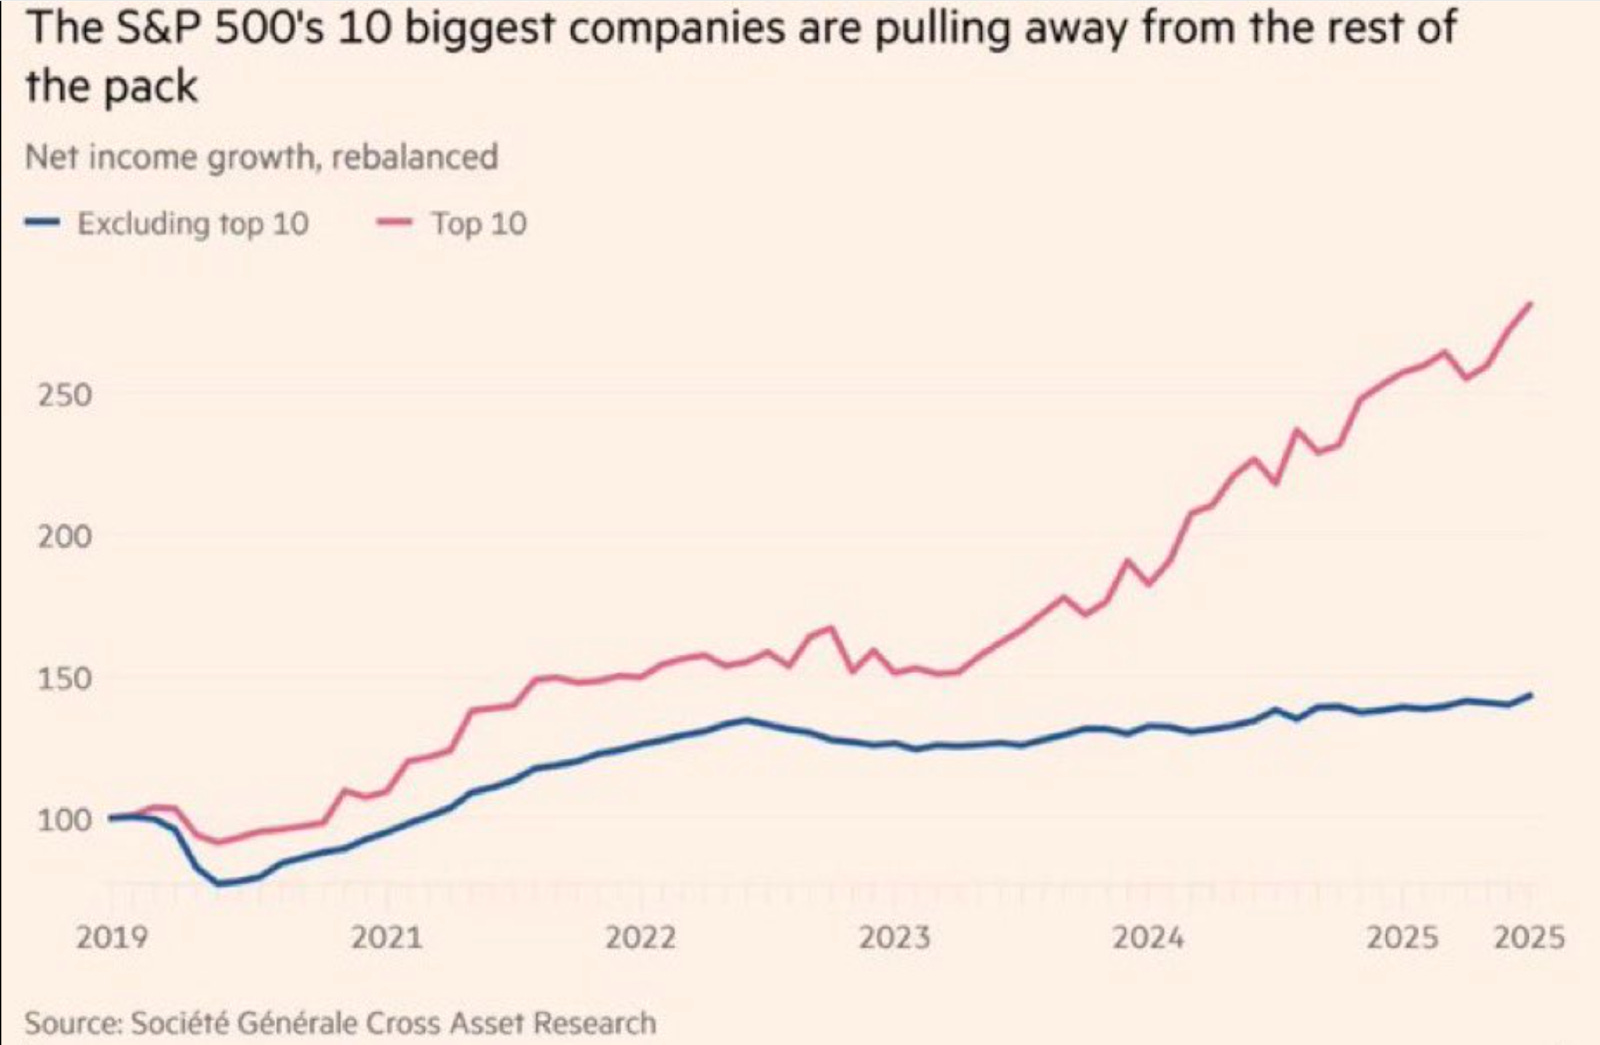
What does this chart show?
If you exclude the 10 biggest companies in the S&P 500, the remaining 490 companies have generated ~no net income growth since 2022.
Why does it matter?
About a year ago, a key talking point in markets was how concentrated the S&P 500 was becoming. With the top 10 companies now representing ~40% of the value and 33% of the earnings of the index1, we’re now at levels of market concentration last observed in the early 1960s, and for good reason, the largest companies are the only ones meaningfully growing their earnings.
While investors routinely bemoan the expensive valuations carried by the largest companies, it seems that the ‘490’ are the companies carrying the expensive valuation given their stagnant earnings growth.
The Bottom Line
History doesn’t show that there’s a clear reason to worry about market concentration. Historically if an investor only held the largest index constituents, they’ve been in the ~same place as holding all 5002.
